


During reverse osmosis systems operation, mechanical problems may occur due to broken gaskets or osmosis membrane interconnectors. These damages generate rejection passage to the permeate side, affecting the quality of the final product and may lead to an accelerated plant shutdown.
Identifying the cause and position of the mechanical damage will allow a solution in less time, avoiding extensive plant shutdowns. However, it is even more critical to make the necessary adjustments to minimize mechanical damage and thus give continuity to the operation, reducing operating and maintenance costs.
Damages in reverse osmosis systems occur in the membranes themselves or in the elements with which the membranes are installed inside the pressure pipes: the interconnectors and/or gaskets (o-rings).
Reverse osmosis membranes can become damaged due to:
- Chemical attack or hydrolysis.
- Affection of the glue lines used to manufacture the membranes.
- Damage to the membrane structure due to flow reversal.
- Abrasion by external material (sand or particulate material).
- Abrasion by displacement of the reject spacer.
In this article we will focus on identifying problems in the gaskets or interconnectors. We will leave membrane problems for future publications.
Elements susceptible to mechanical damage in reverse osmosis systems:
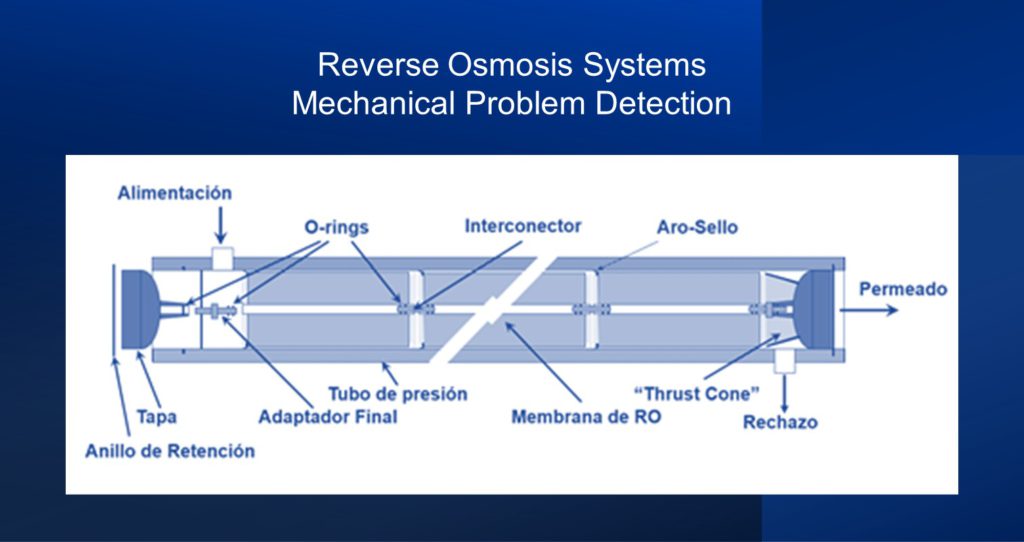
When installing the membranes inside the pressure pipe, some interconnectors join the central tube or permeate the collector of a membrane with the central pipe of the neighboring membrane or with the final connectors where the permeate will exit. These interconnectors are fitted with O-rings to isolate the permeate side from the feed side and avoid contamination.
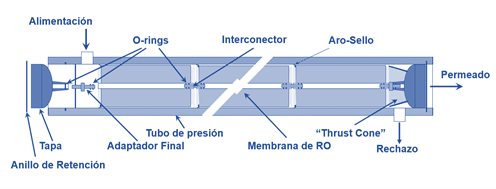
General diagram of the elements of a pressure pipe
Within these systems, the gaskets of the interconnectors, or o-rings are the elements most susceptible to damage since, due to their low cost, materials are selected that do not generate abrasion in the interconnectors or permeate tubes of the membranes, seeking that in any eventuality, these are the elements that present failure.
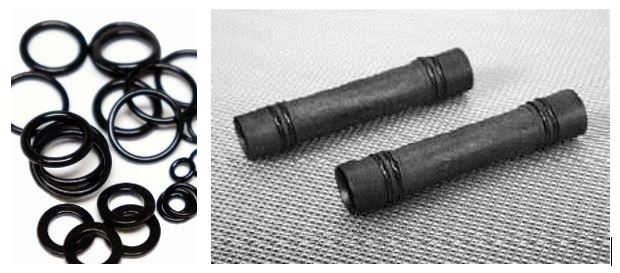
Examples of o-rings and interconnectors with their o-rings
Diagnosis of mechanical damage
Just as any fouling is evident in the variation of parameters such as flow, pressure, and the passage of salts (permeate conductivity), the same happens with any mechanical damage in a reverse osmosis system. The following table shows the change in the system performance when various mechanical failures occur in osmosis systems.
| Cause | Change in performance | Correction | ||
| Permeated Flow | Rejection Sales | Pressure drop | ||
| Passage through gaskets, sealing rings, or central tube | Increase | Decrease | No variation | Replace affected part |
| Membrane leakage due to backpressure or abrasion | Increase | Decrease | No variation | Replace Membrane |
| Degradation of membrane support by oxidation | Increase | Decrease | No variation | Replace membrane |
| Degradation of the membrane support by solvent | Increase | Decrease | No variation | Replace membrane |
| Inlay | Decrease | Decrease | Increase | Cleaning, improve fouling control |
| Biological Fouling | Decrease | No variation | Increase | Cleaning, disinfection |
| Colloidal Fouling | Decrease | Decrease | Increase | Cleaning, improve pre-treatment |
| Chemical Fouling (Absorption) | Decrease | No variation | No variation | Cleaning, improve pre-treatment |
Additionally, the speed with which a variation in the operating parameters occurs may be an indication of the damage that has happened: colloidal fouling may be gradual and occur within a few weeks, chemical attack produced by an oxidant may be evident in a few hours, depending on the concentration of the oxidant in the water, and the breakage of a gasket or an interconnector may be immediately visible.
Therefore, it is important to keep a record of the operating parameters and normalize them in search of operating changes that are not evident in the short term, and to identify, if after a shutdown or maintenance, there was a change in any of the parameters.
When there is damage to a gasket or interconnector, the passage of water from the rejection side to the feed will be reflected as an increase in the conductivity of the permeate. In some cases, the overall conductivity of the system will continue to meet the required quality values. But a general increase will be evident in the short term that will require a more detailed review of the system. Here the first action is to perform a “pipe by pipe profile” to sample the conductivity and identify in which pipe the salts may be passing through.
Pipe by pipe profile
Under normal operating conditions, the first stage pressure tubes will have similar conductivity values in the permeate, and likewise, the second stage tubes will have conductivity values close to each other. And always, the first stage will have lower conductivity values than subsequent stages.
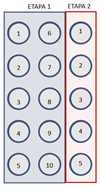
The tube-to-tube conductivity profile consists of measuring the conductivity of the permeate in each pressure tube; in the example, the values are shown for an osmosis system with two stages and ten pressure tubes in the first stage and five pressure tubes in the second stage:
| Normal conditions | ||
| Stage 1 | Stage 2 | |
| Tube 1: 113 microS/cm | Tube 6: 116 microS/cm | Tube 1: 278 microS/cm |
| Tube 2: 121 microS/cm | Tube 7: 112 microS/cm | Tube 2: 285 microS/cm |
| Tube 3: 105 microS/cm | Tube 8: 122 microS/cm | Tube 3: 290 microS/cm |
| Tube 4: 109 microS/cm | Tube 9: 109 microS/cm | Tube 4: 280 microS/cm |
| Tube 5: 104 microS/cm | Tube 10: 115 microS/cm | Tube 5: 292 microS/cm |
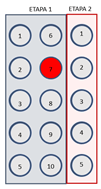 When performing the conductivity profile in the event of mechanical damage, it is possible to observe an increase in the conductivity in one or more tubes. For example, in tube 7 of the first stage:
| Damage to pipe No. 7 of the first stage | ||
| Stage 1 | Stage 2 | |
| Tube 1: 113 microS/cm | Tube 6: 116 microS/cm | Tube 1: 278 microS/cm |
| Tube 2: 121 microS/cm | Tube 7: 725 microS/cm | Tube 2: 285 microS/cm |
| Tube 3: 105 microS/cm | Tube 8: 122 microS/cm | Tube 3: 290 microS/cm |
| Tube 4: 109 microS/cm | Tube 9: 109 microS/cm | Tube 4: 280 microS/cm |
| Tube 5: 104 microS/cm | Tube 10: 115 microS/cm | Tube 5: 292 microS/cm |
In this example, it has been possible to isolate the problem to only one of the permeate tubes; the next step is to identify which membrane can present the damage. For this, it is necessary to probe the permeate tube.
Permeate tube probing
Permeate tube probing consists of inserting a hose through the central tube of the housing, so that the hose can be extracted approximately 1 meter, which is equivalent to the length of a standard osmosis membrane. And to be able to take a sample of the permeate in the center of each of the membranes. For the details of this procedure, follow the recommendations of the membrane manufacturers.
By recording the conductivity on each of the membranes, it is possible to identify a sudden increase in conductivity in the example on membrane 4.
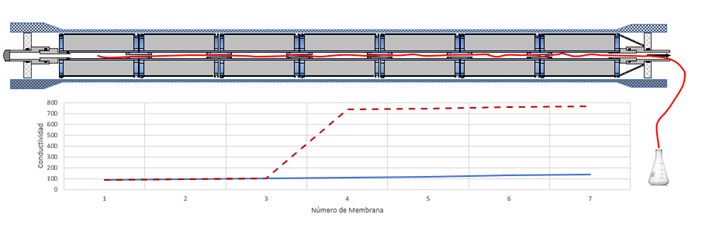
General diagram of the elements of a pressure pipe
By making this profile, it is possible to identify the housing to be intervened and to prepare the necessary spare parts for the intervention.
If you need advice on these activities, ask for technical support from our experts. If you want to know more information about our service and portfolio of products for water treatments, click on this link.